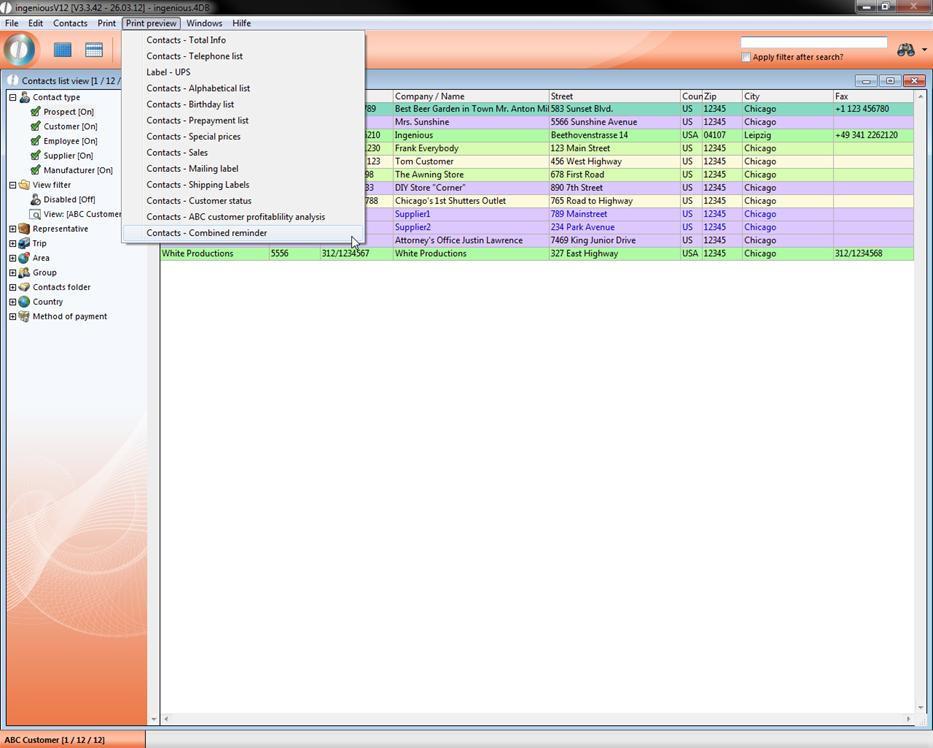
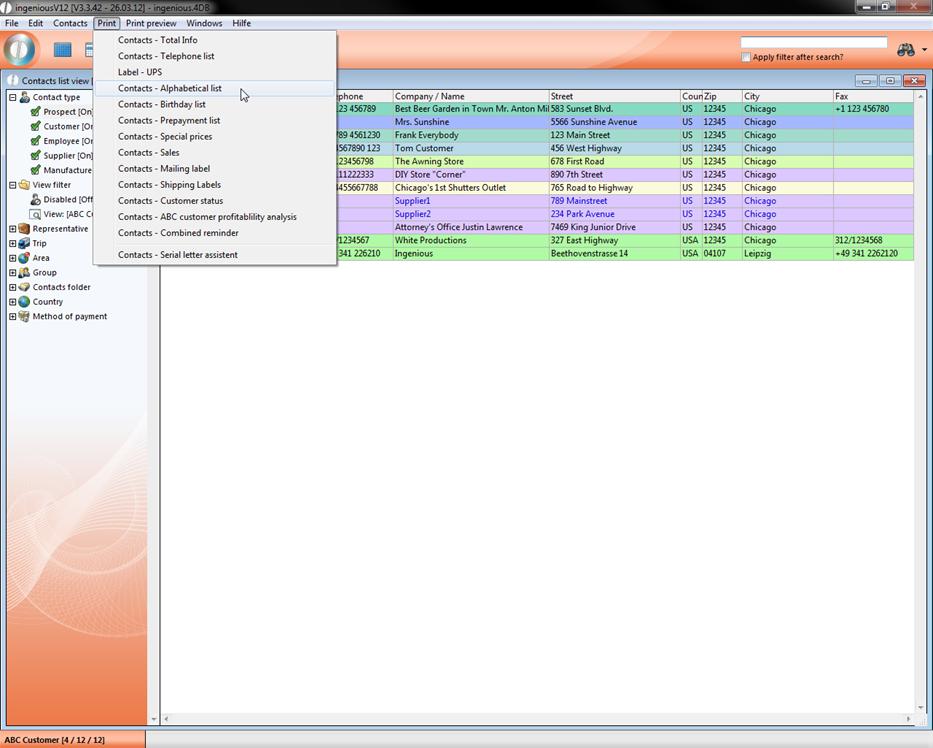
Under the menu option “Print” in the main window of Ingenious.V12, you will find different print lists. Among them are “Simple lists” such as the “Alphabetical list “, for example. With their assistance, you can print the selected contacts records in alphabetical order. Here you will also find lists with complex integrated functionalities that not only print data, but that process and edit them beforehand according to the set target. These are the “Complex lists”, such as the “ABC contacts profitability analysis “, for example.
Simple lists
The printing of data is still essential today. Therefore Ingenious.V12 quotations a range of possibilities that handle this quickly and easily. You only have to click on the menu bar on the menu item “Print” or “Print preview” and select the desired printing preferences from the pop-up menu. All printing reports in the global settings are only optionally selected as advanced and customizable.
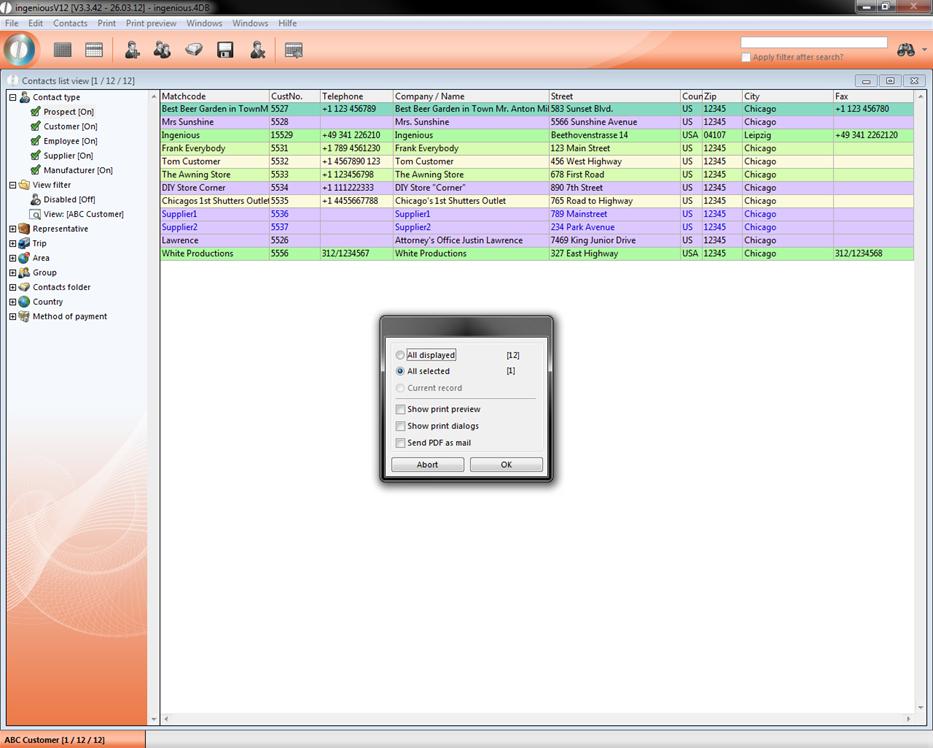
After you have selected a menu item, another window appears in which, among other things, the number of records to be printed can be selected. Among all records, you have the choice to select (marked) records and the current record (this is only activated in the contacts detail view).
An example:
Practice printing records
1. With the ![]() button retrieve all contacts.
button retrieve all contacts.

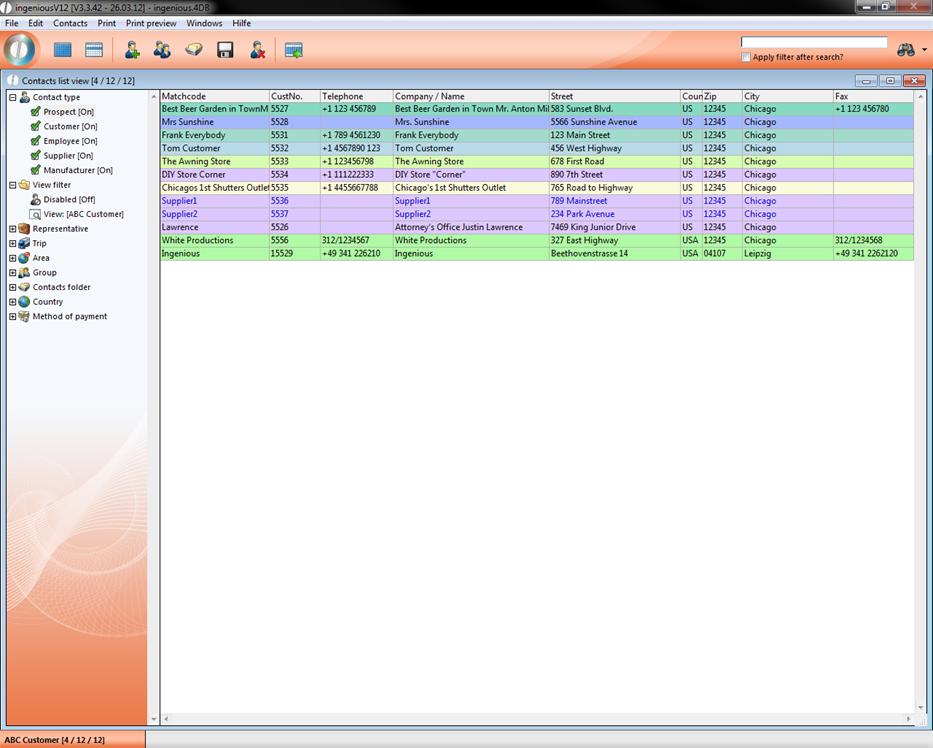
2. Sort the records according to city. Click on the same title in the column header.
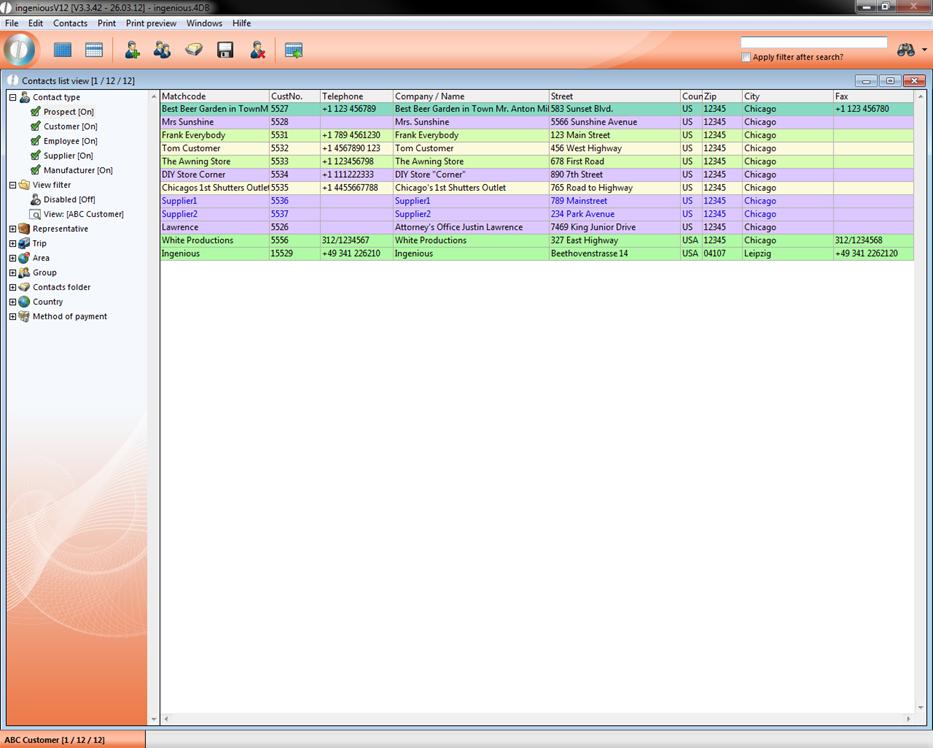
3. Mark the first four records.
4. Select “Print” from the main menu and select the entry “Contacts - Alphabetical List”.
Now you see the following monitor.
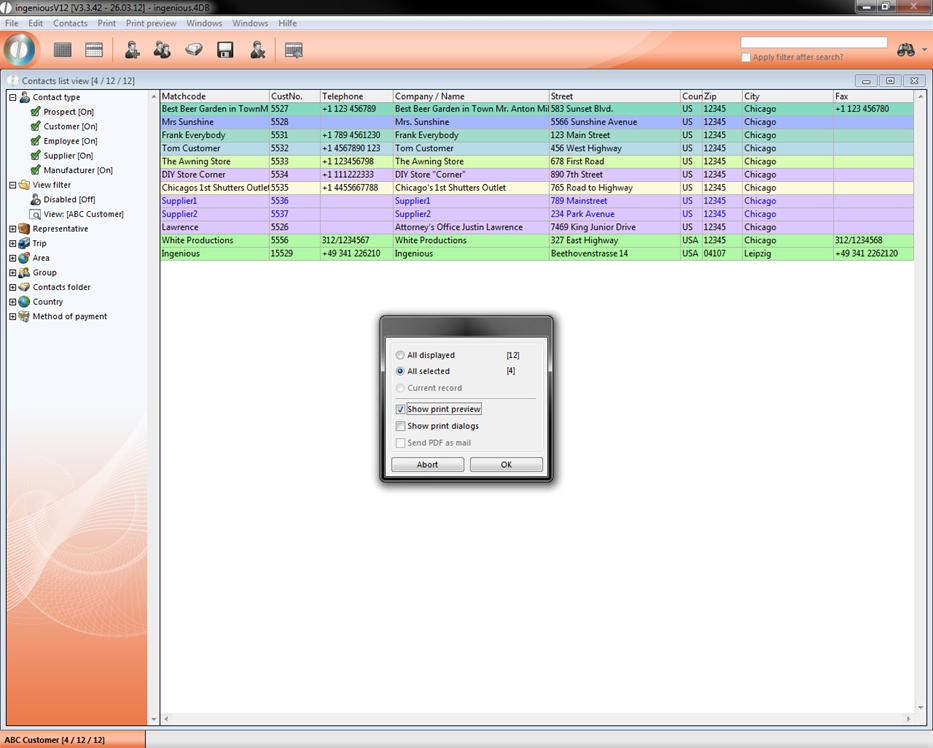
5. Select the setting “All selected” and “Show print preview”.
If you select the option “All displayed (12)”, then all 12 records will be printed alphabetically. With the option “All selected (4)”, then only those records that you selected will be printed. The checkmark next to “Show print preview” means that you will first see a page view. Click on “OK”. A new window with the print preview will appear.
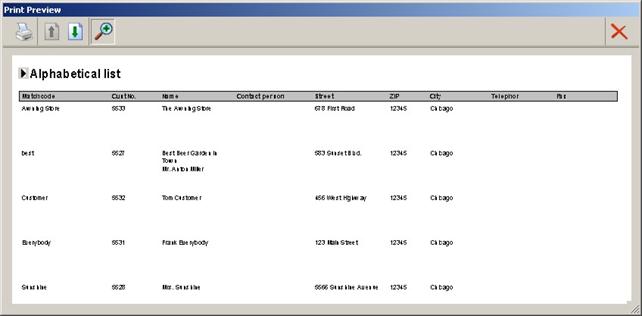
Window with the page view of the printing job
In the upper left corner, you will find the following buttons:
![]() This button closes the window
This button closes the window
![]() This icon prints the pictured page(s)
This icon prints the pictured page(s)
![]() When you update this button, the previous page will be displayed. In case there is no previous page, then it is inactive (grey display)
When you update this button, the previous page will be displayed. In case there is no previous page, then it is inactive (grey display)
![]() The next page is displayed with the help of this symbol.
The next page is displayed with the help of this symbol.
![]() This button increases or minimizes the page layout.
This button increases or minimizes the page layout.
6. Click on the button to print the records
The list will be sent to the initialized printer.
Complex lists
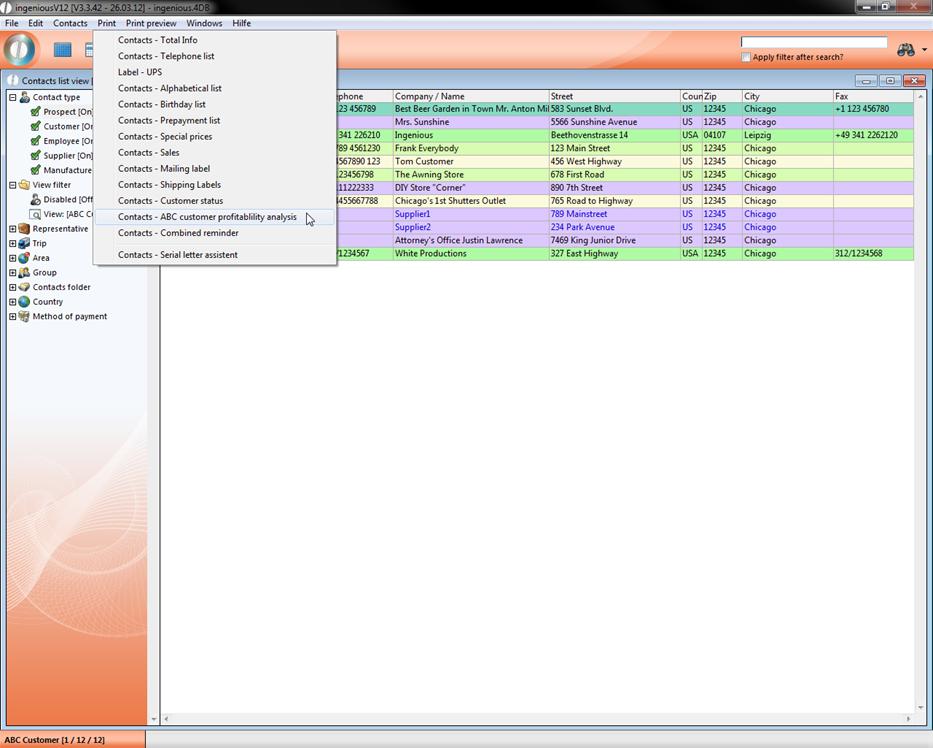
In the “Print” menu of the complex lists, you will find the “ABC contact analysis”. This list analyses your best customers for you and gives you the overview of their sales volume for this year as compared to last year. With the help of this list, you can then for example, decide on the quotations for rebates, special prices or incentives. In order to conduct an ABC analysis of the 10 best clients, please proceed as follows:
Practice with ABC contacts profitability analysis
1. First retrieve all of your contacts with the ![]() button.
button.
2. Afterwards, select the menu item “Print/Contacts - ABC contact profitability analysis”.
A window will appear where you can do a query for the number of records for the ABC analysis.
3. Click here on “All displayed” and confirm with the “OK” button.
In the window displayed, you have the opportunity to more closely define the contents of the ABC analysis. The base fiscal year of the analysis can be specified. In addition, you can enter how many contacts (up to max. 30,000) should be added to the complete list. You also have the possibility to determine a sales amount for the selected contacts, respectively contacts with fewer sales who are hidden.
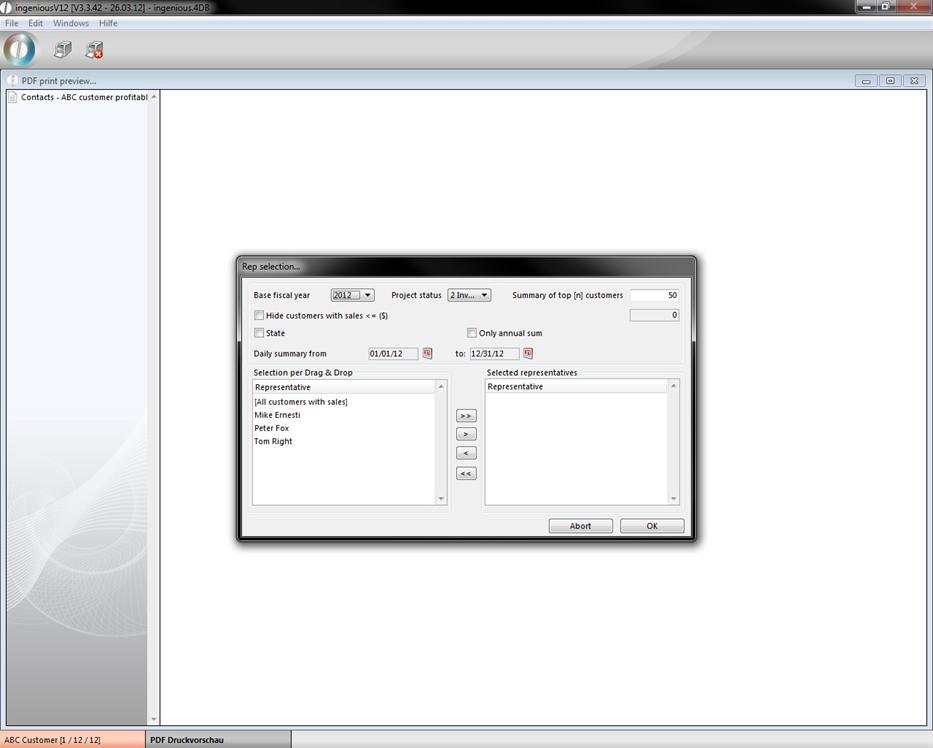
ABC contact analysis setup
You can select whether the analysis for all contacts is to be provided, or only customers with one/several selected contact representatives (s). In order to create these settings, you must drag the desired representatives with the mouse from the left field (“Selection with Drag & Drop “) into the right field (“Representatives will be selected”). In order to analyze all contacts, you drag only the top line (“[All contacts with sales] “) into the right field.
4. Select all contacts for the analysis and limit the number of the best contacts to “10”. Then press the “OK” button to start the analysis.
Since the analysis must examine and compute the calculations of more than100, 000 contacts, this can take some time. However, you are always informed about the current status of the analysis. As soon as the analysis is finished, the resulting list appears.
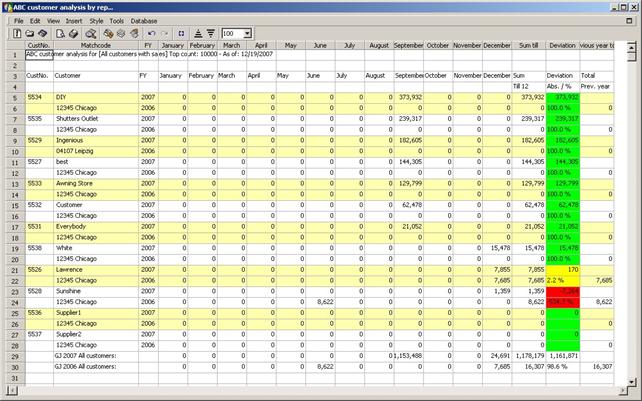
An example of a completed ABC contacts analysis
If you look more closely at the completed analysis, you will find all of the important information that is necessary for evaluating the change in sales of each contact. This way you can compare the individual monthly sales and the current (cumulated) annual sales with that of the previous year for all contact as well as for each individual contact. In addition, the finished analysis as well as the underlying color variation of the annual sales is available as a USD amount and as a percentage value. In the standard setting, the colors appear in the following scheme:
Annual sales turnover < 0 % Previous year sales turnover => RED
Annual sales turnover <= 3 % Previous year sales turnover => YELLOW
Annual sales turnover > 3 % Previous year sales turnover => GREEN
Individual color schemes can also be implemented.
Report „Contacts – Sales statistic“
The report “Contacts – Sales statistic” is not included in the standard configuration of ingenious V12, but you can create it. He works similar to the “ABC contact profitability analysis” and lists the sales for specific contact groups in a time span, but it is more complex.
Create the report “Contacts – Sales statistic”
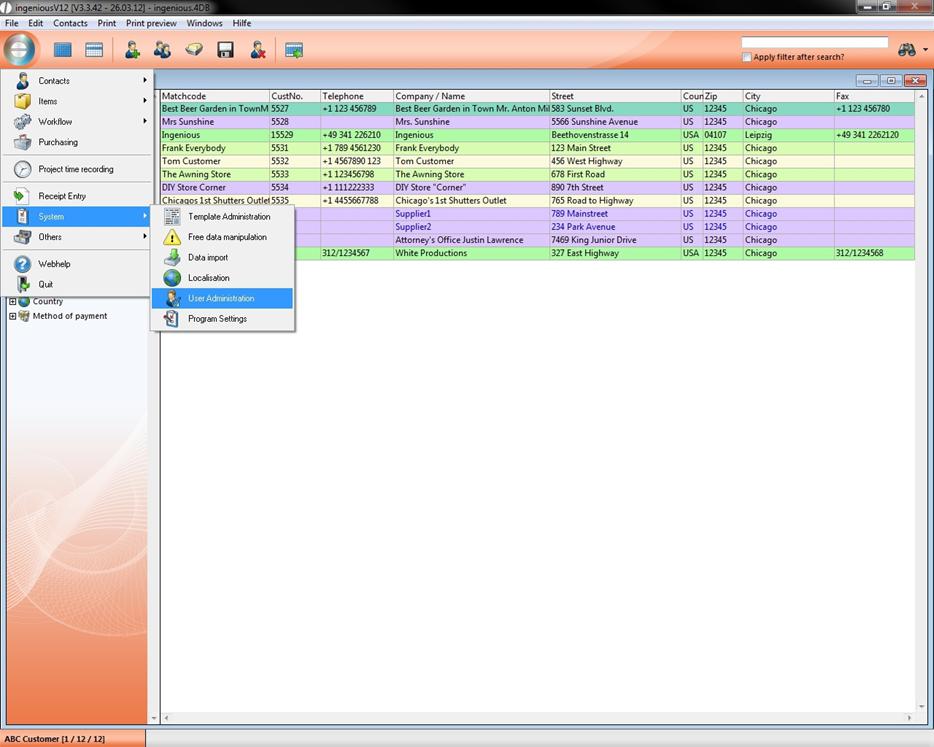
1. Open program settings
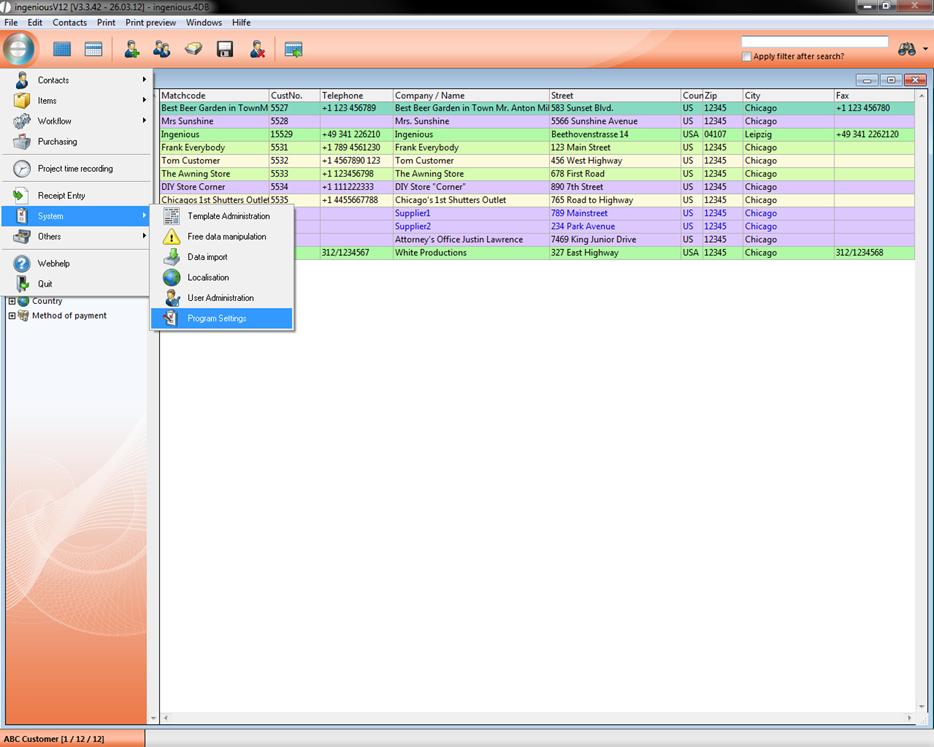
2. Choose “print report” in the left area and click on ![]() in the icon bar
in the icon bar
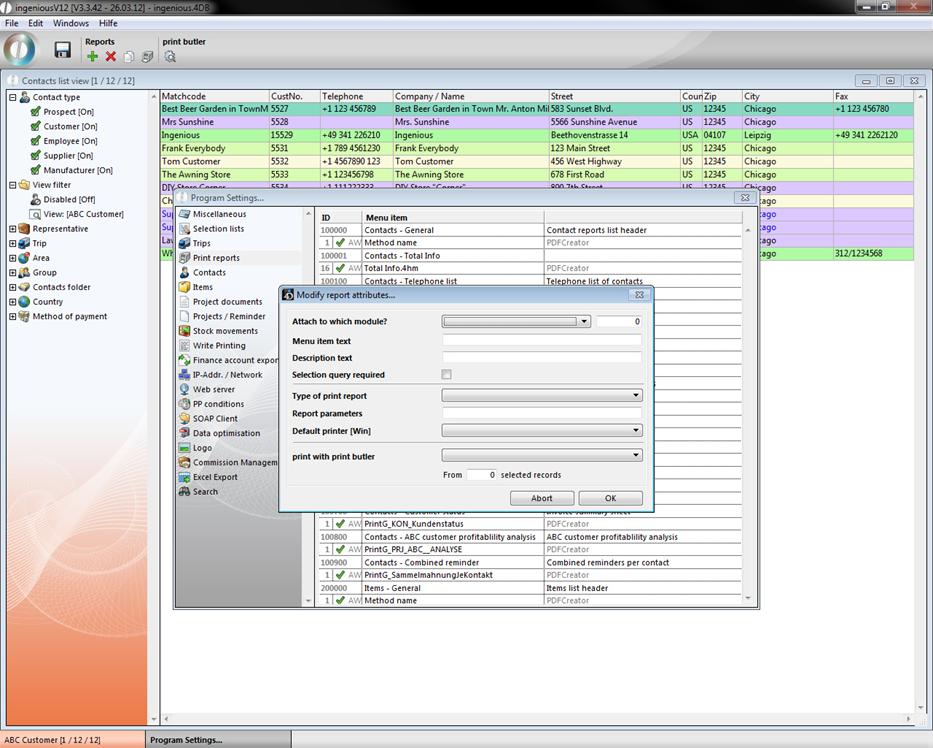
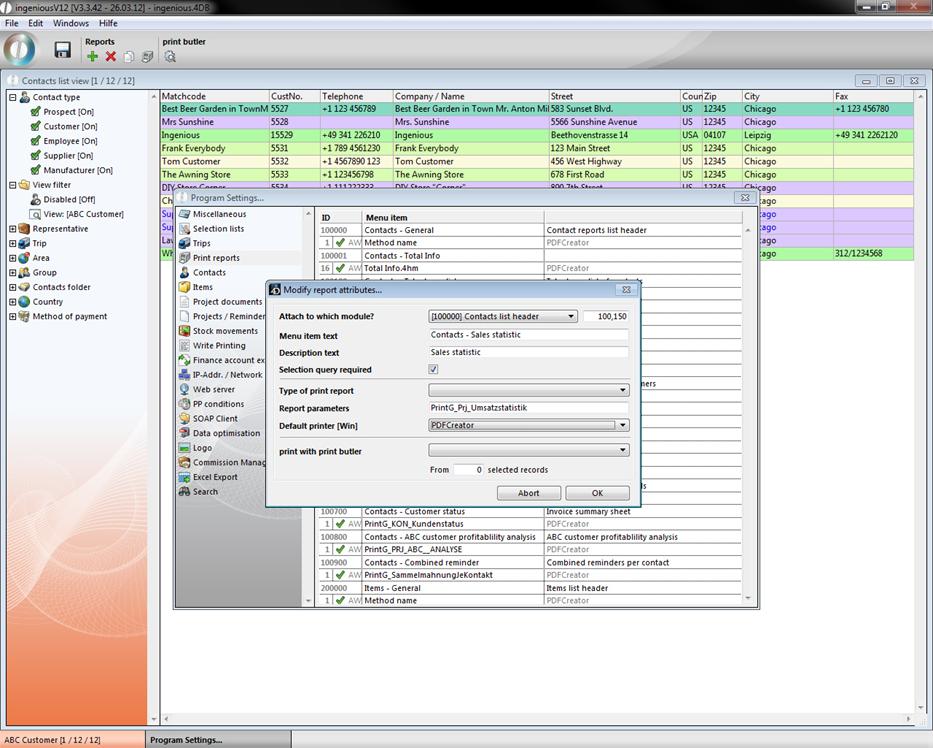
3. Fill in the data as shown in the next picture. It’s important, that the report is connected to the contacts module, is named “Contacts – Sales statistic” and the value of report parameters is “PrintG_Prj_Umsatzstatistik”
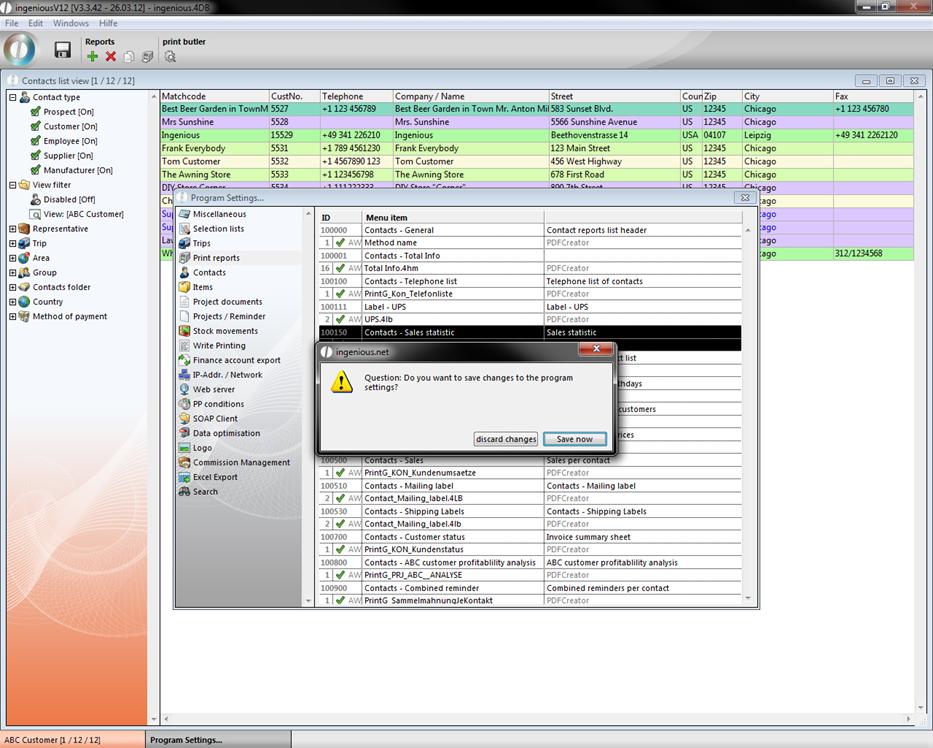
4. Commit the dialog with OK and the new report will be shown in the list. Close the program settings und save the changes
5. To be able to use the report, you have to activate the specific report right in the user administration. Open up the user administration.
6. Choose the tab “Report rights” and activate with a double click the report right “[100150] Contacts – Sales statistic”
7. When you open the “Contacts” module, in the print menu you can find the new created report now. (hint: if you can’t find it, just restart ingenious v12)
8. When you click on the report a window will open up where you can make various settings, to customize the sales statistic to your individual wishes.
You can choose the regarded project state, time span, compression (CW, month, fiscal year), contact group of a customer number range (only possible if all customers have a numeric customer number), a assignment to a representative or an area, the selection best customer (or all) and the masking of customers having sales less than x. Furthermore you can set different colors for the ABC customers, by double clicking the color area. It is also possible to make subtotals and/or sales rep appointments visible. Likewise you can color new customers. By clicking “Show selection” relevant records will be listed in the contacts list. When you click the “OK” button the sales statistic will open up in an ingenious v12 table.